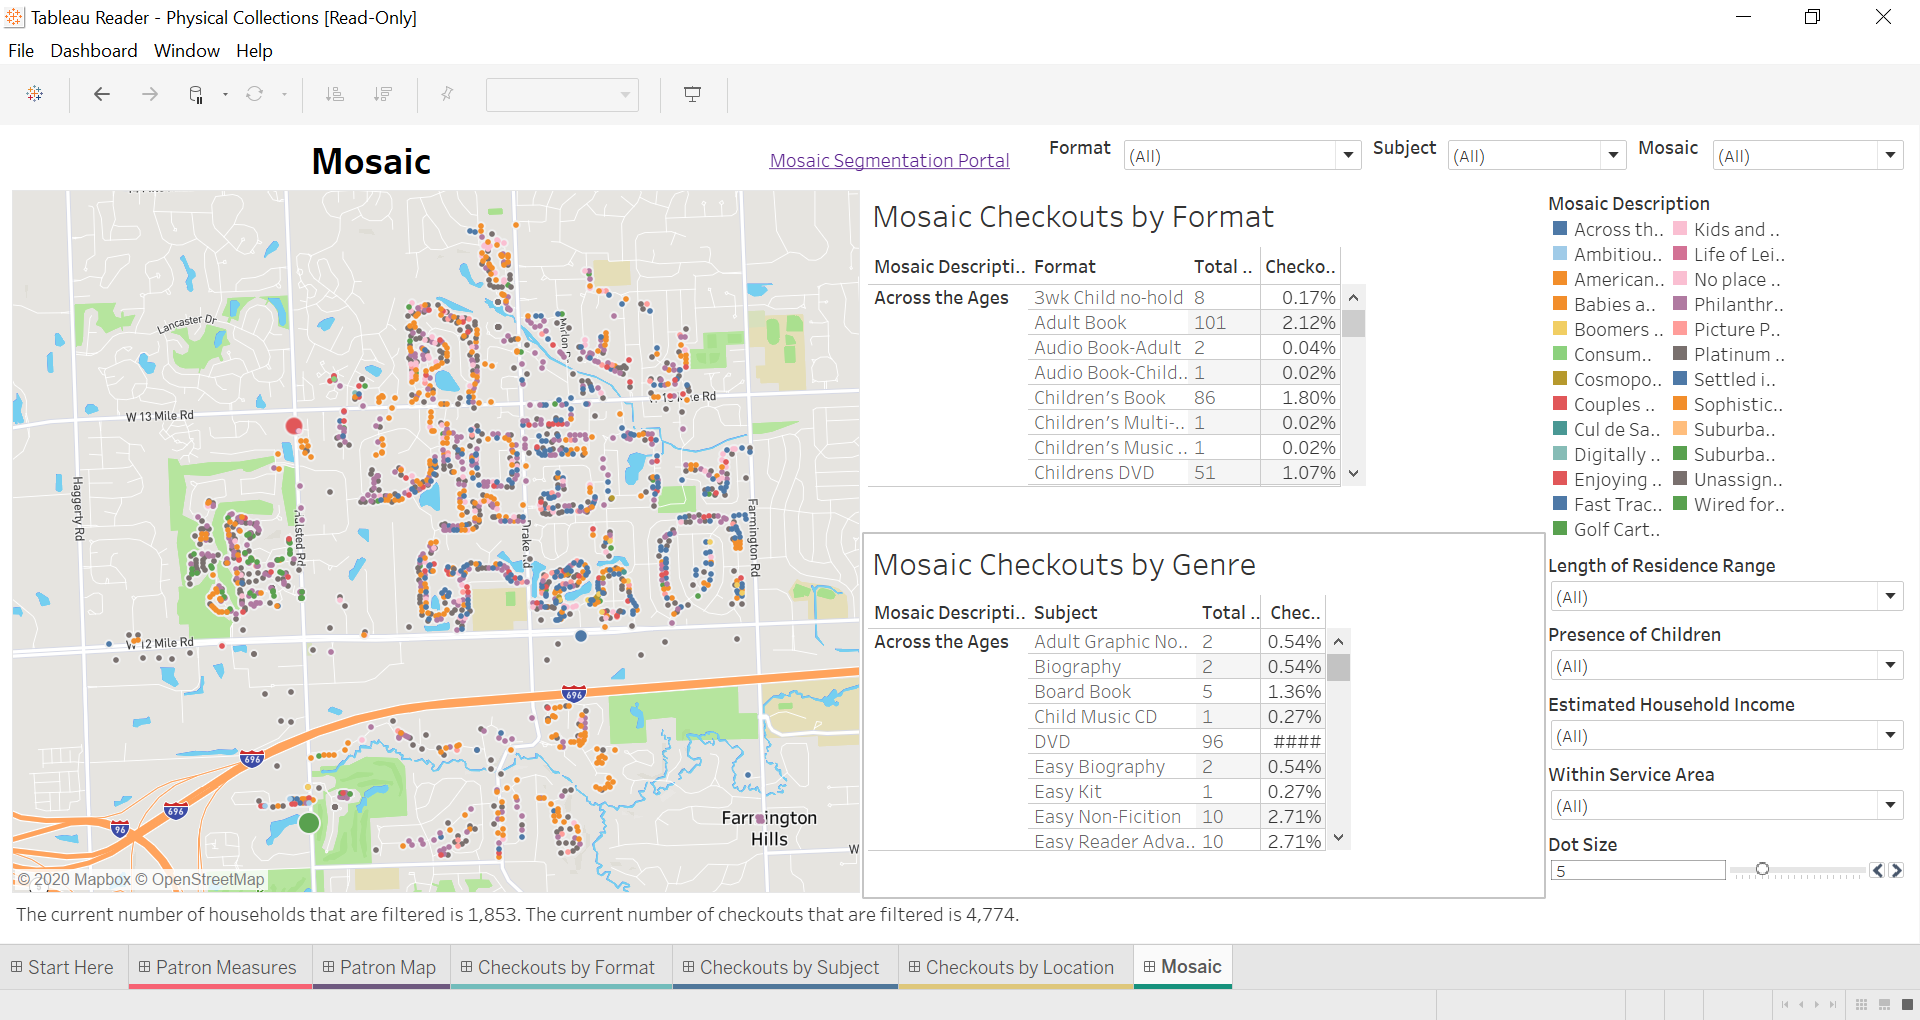
Checkout data made actionable.
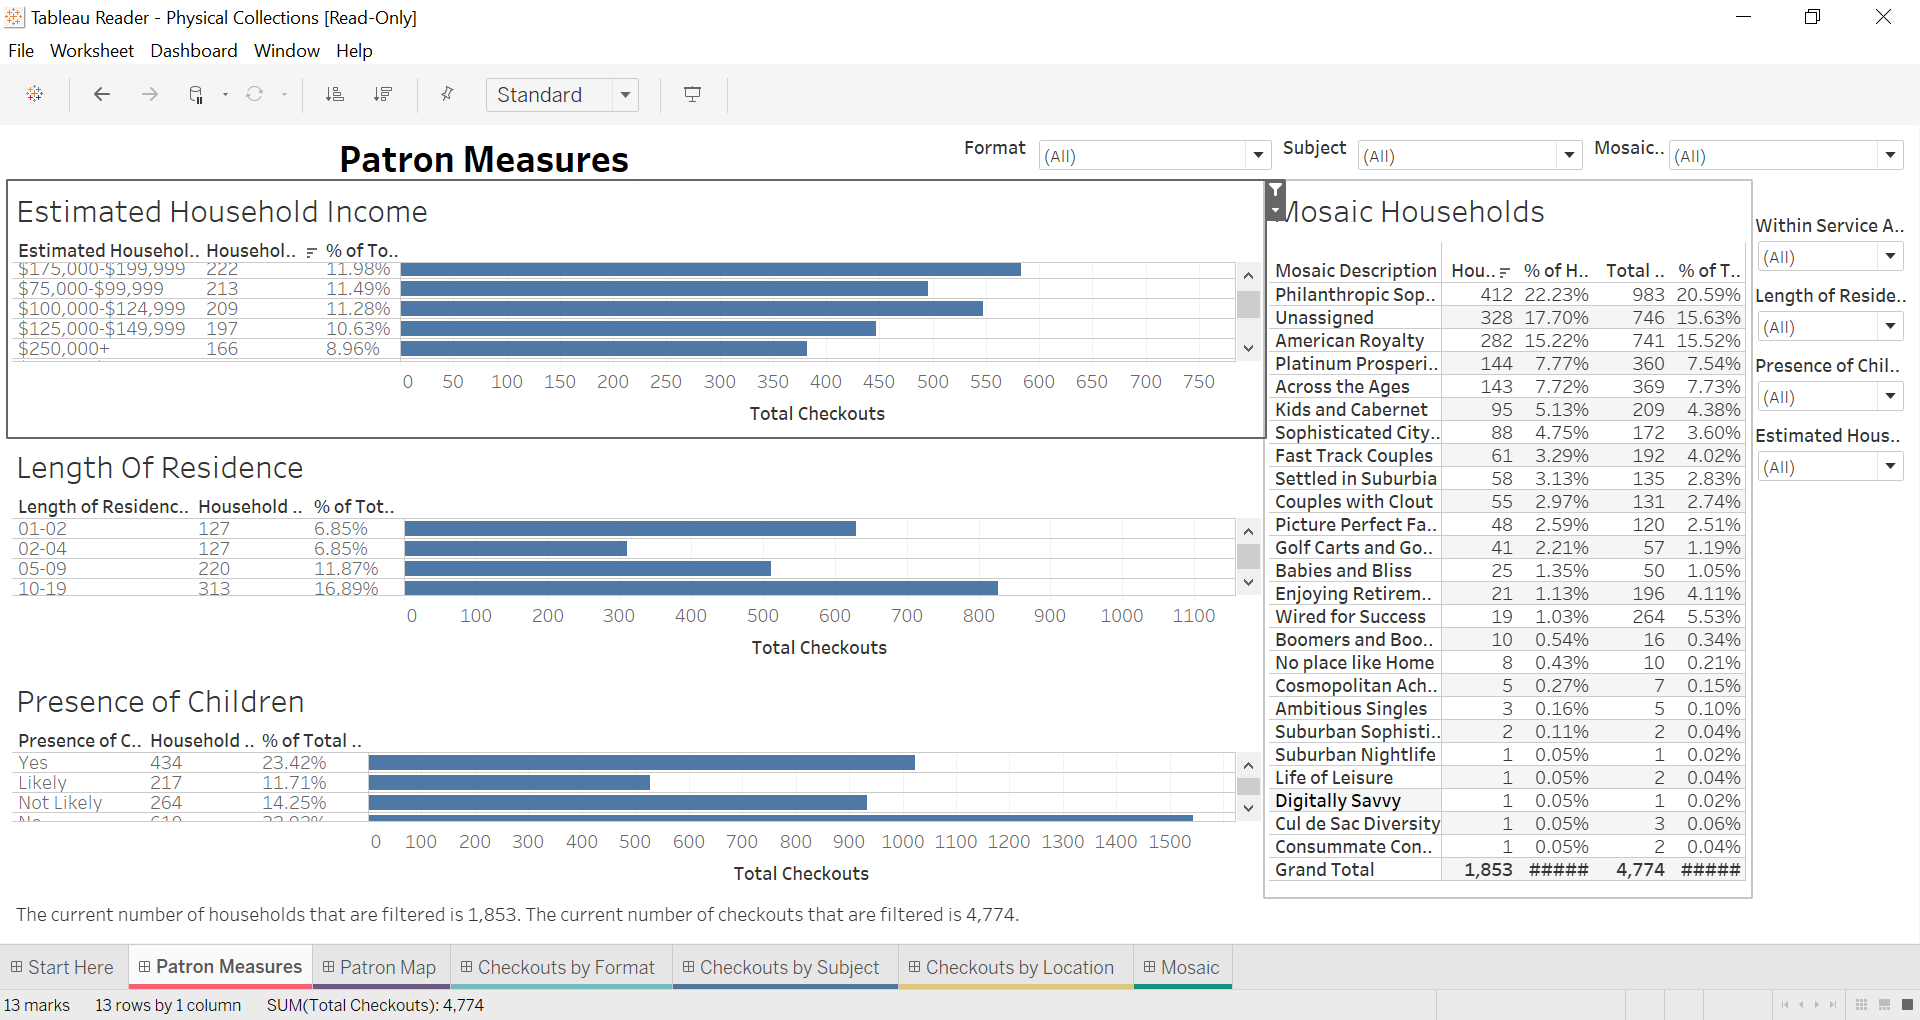
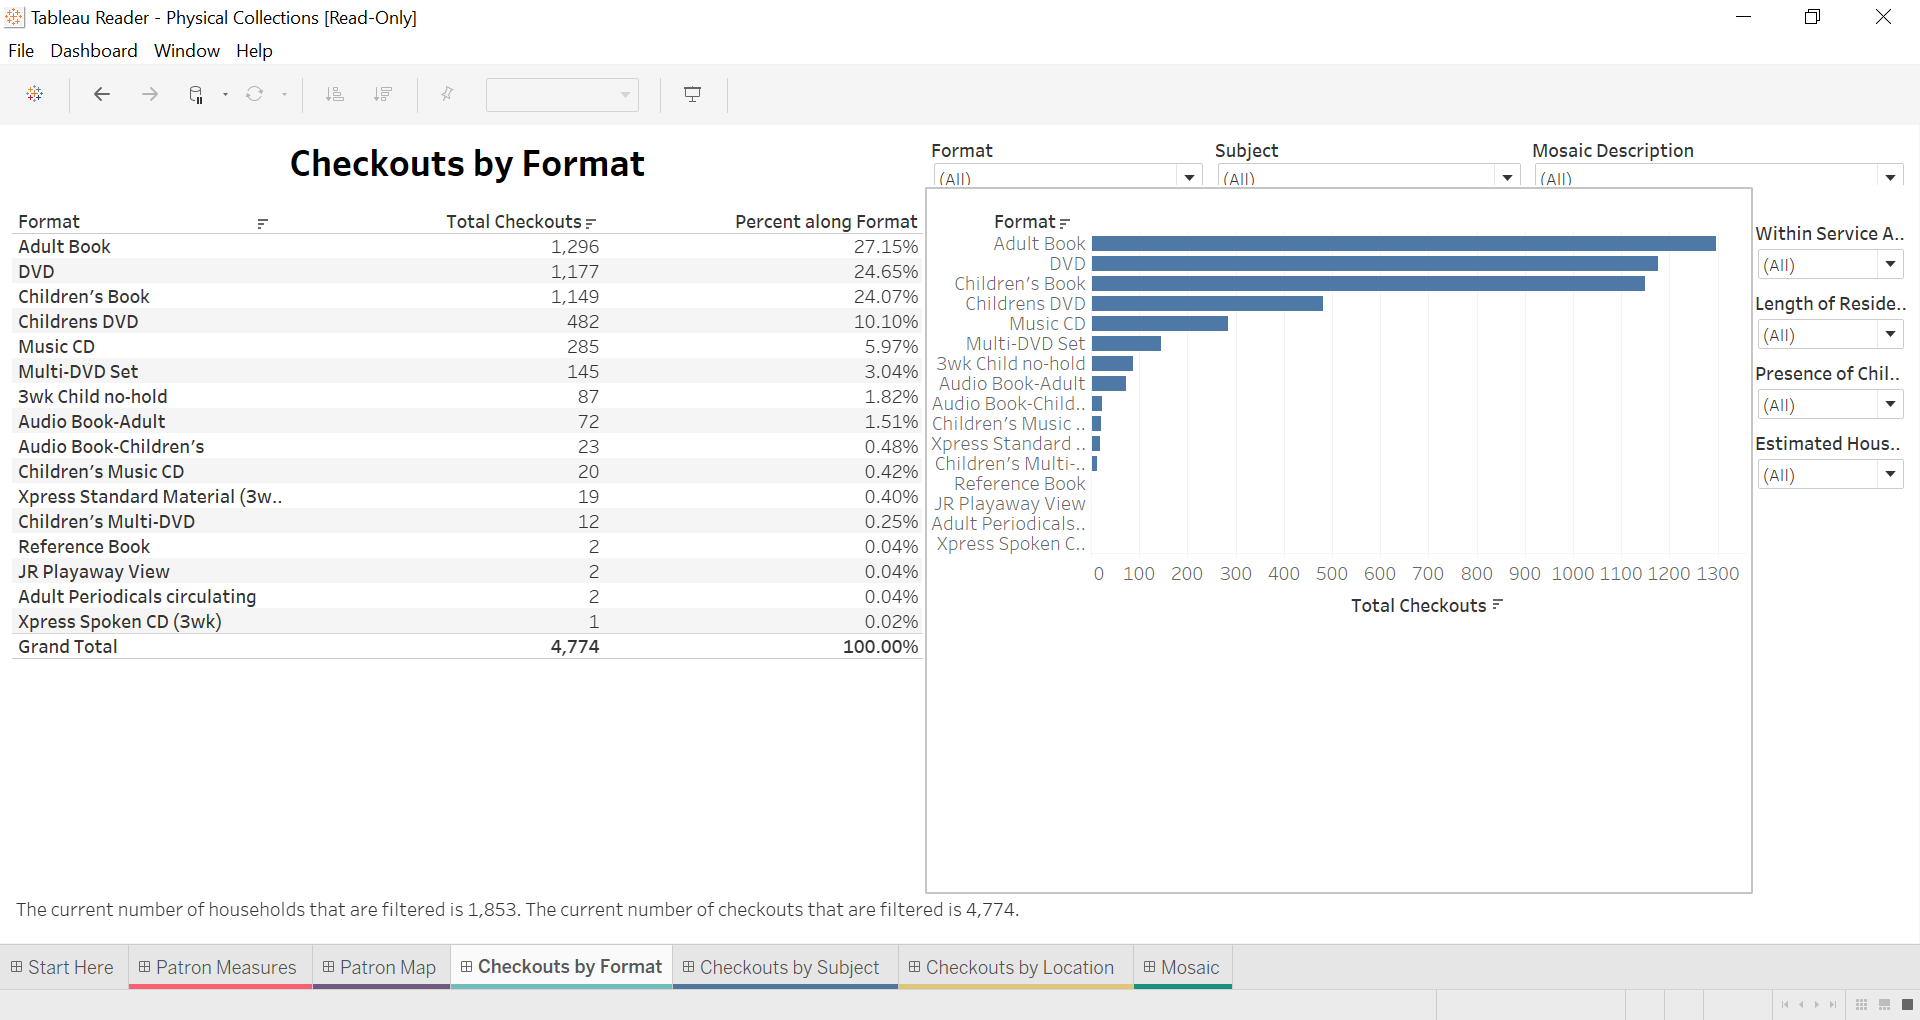
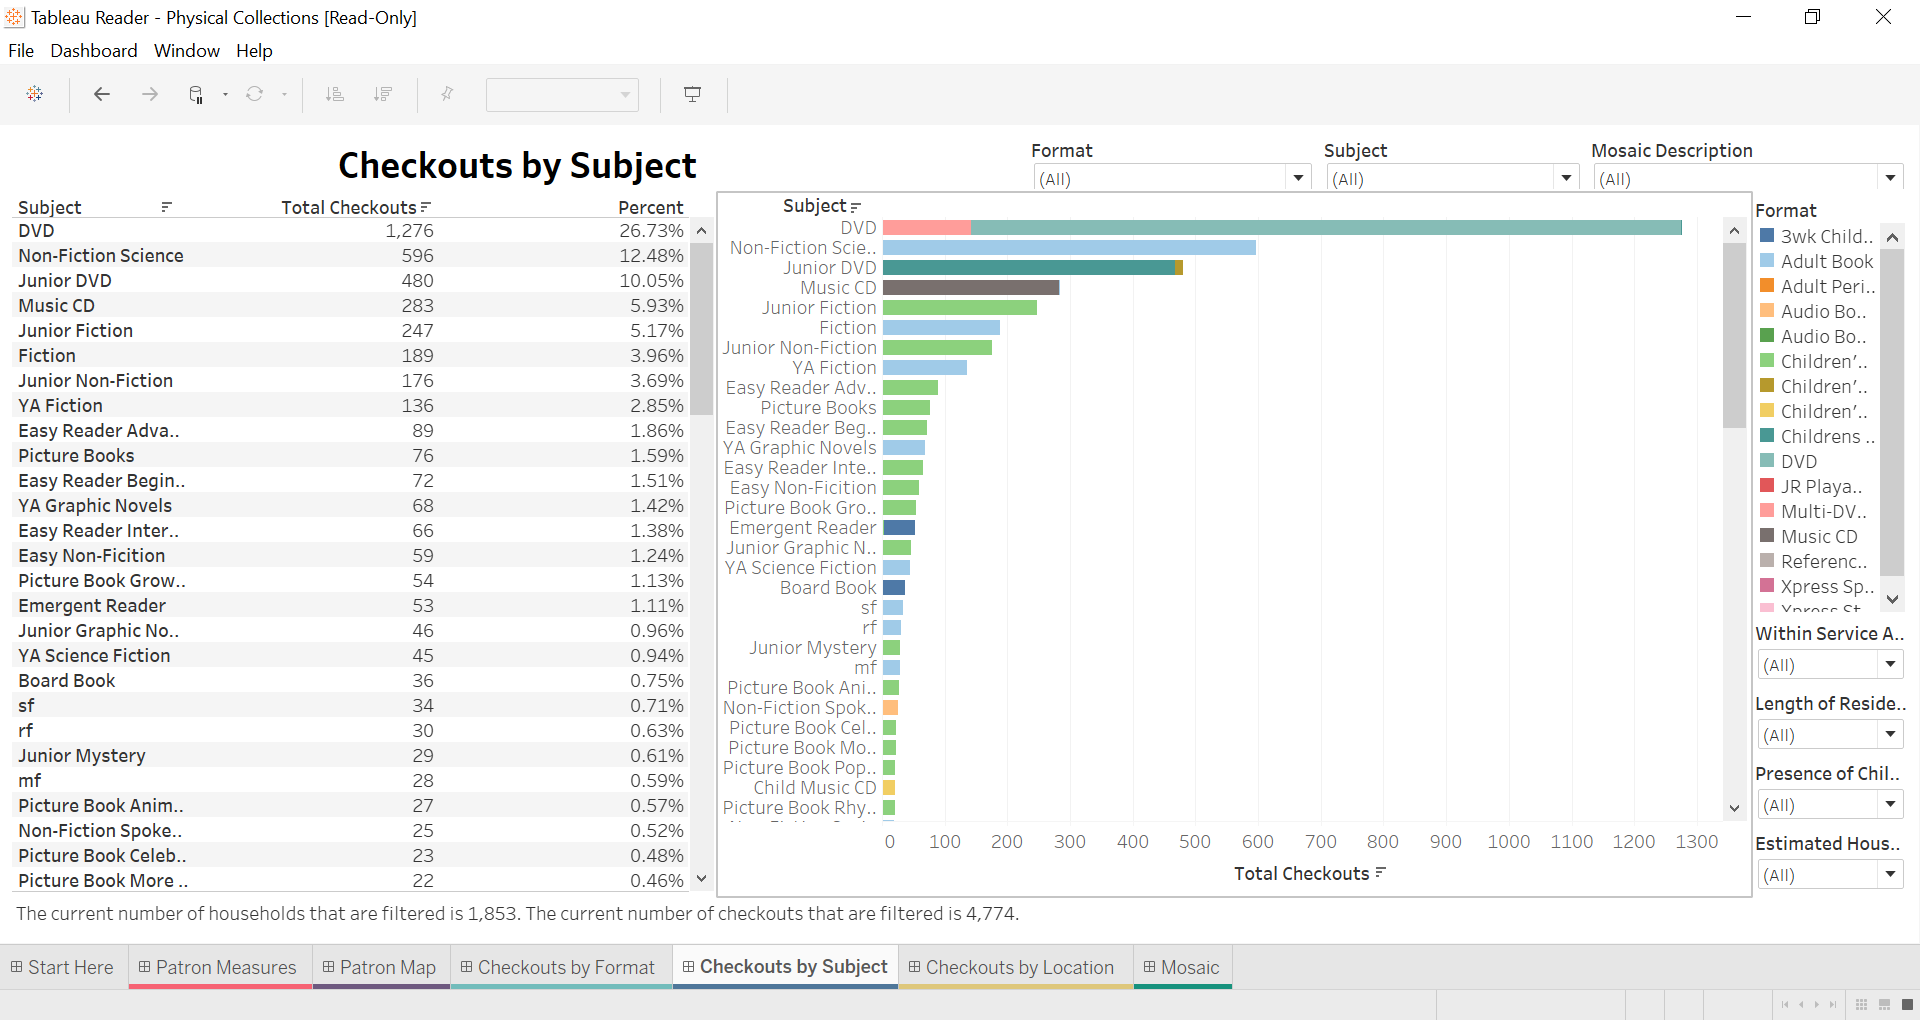
Combine checkout data from your ILS with segmentation and lifestyle data to assess how your community is using your print resources. Many existing collection analysis tools provide basic insight into the number of checkouts by genre or format. Whether you’d like to analyze by genre or household type, this dashboard helps you understand not only what’s being checked out but by what segments, when, how often, and more.
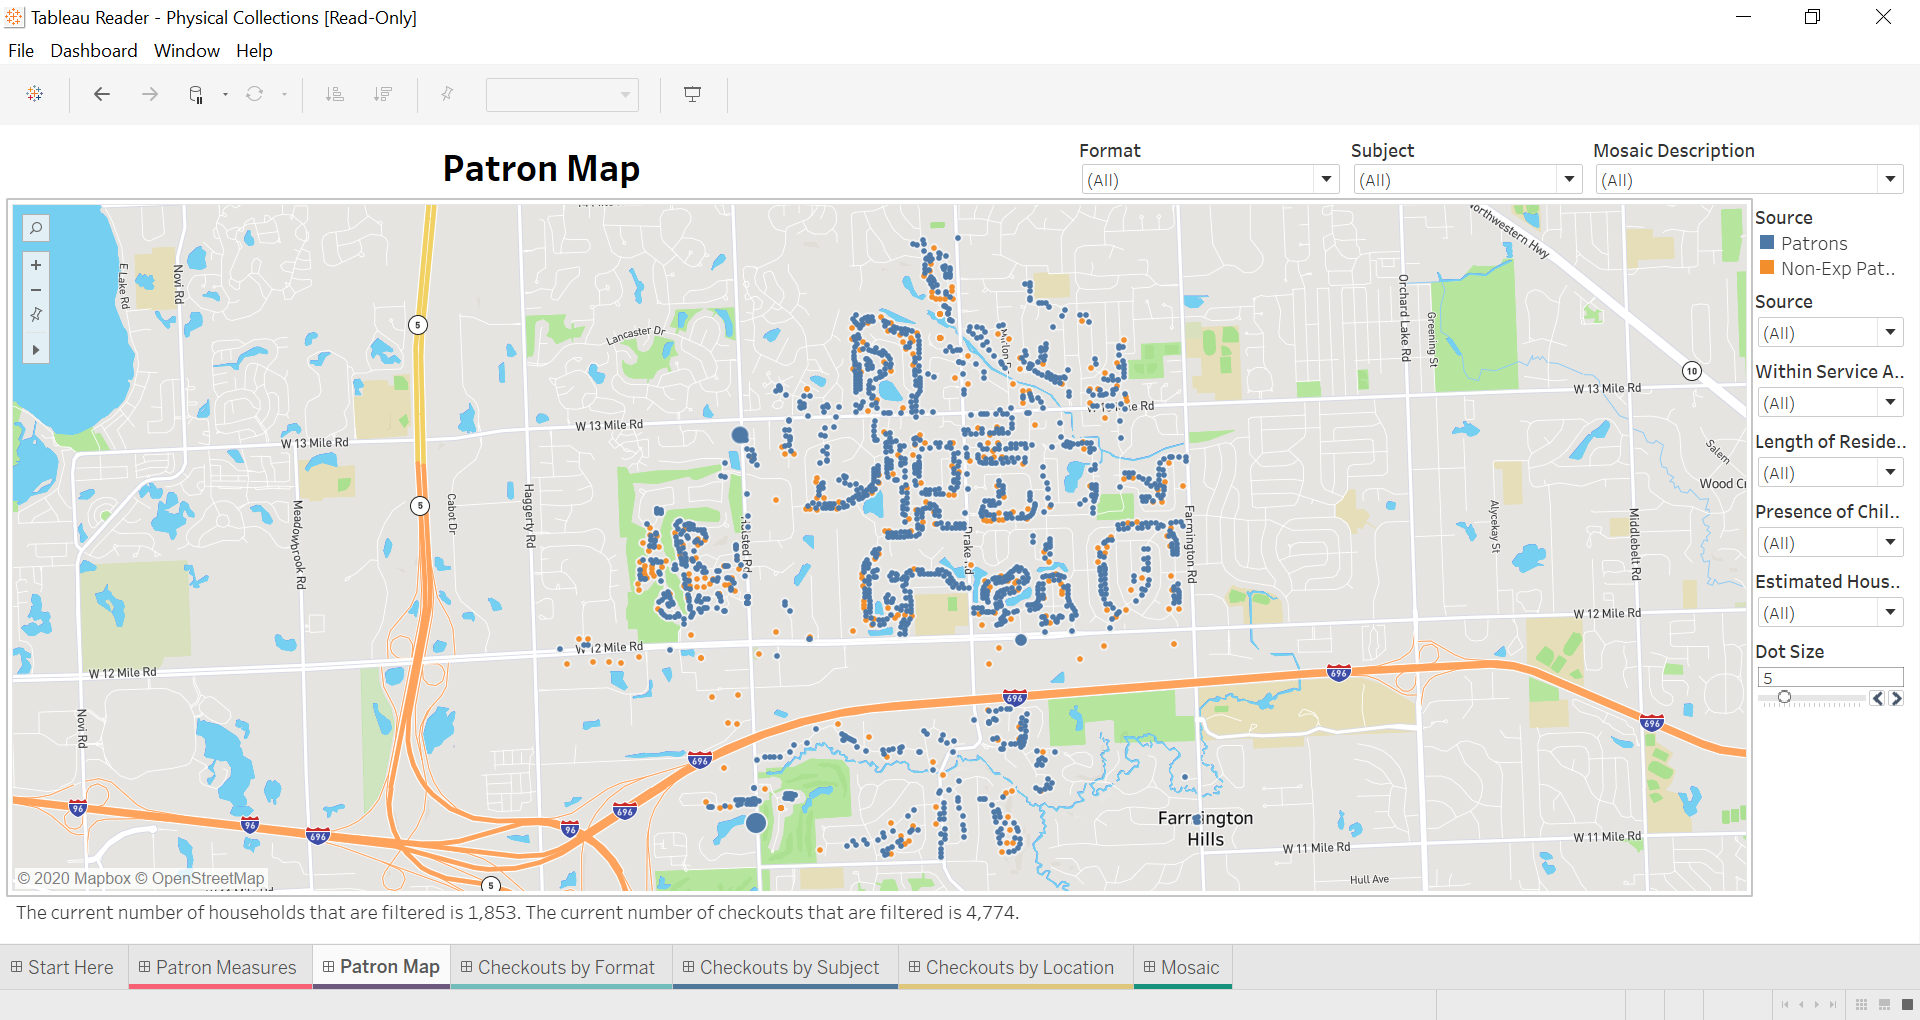
Gale Analytics effortlessly merges your library’s integrated library system (ILS) data with Mosaic® segmentation from Experian and other datasets. Using dashboards in Tableau Reader, users can segment households based on demographic and lifestyle criteria—drilling down into rich visuals, dynamic maps, and downloadable custom mailing lists based on segmentation.
Look Inside
Platform Features & Tools
Mosaic Lifestyle Segmentation
Understand patrons using household-based segmentation from Experian, which classifies all U.S. household neighborhoods into 71 unique profiles called Mosaic segments.
Ensure Patron Privacy
Designed to protect the privacy of individuals, addresses and circulation data are disassociated from customer names. All data research is blended in a secure cloud environment, and output goes directly back to the library account.
On Demand Reporting
Customize your dashboard by modifying the service area, selecting cities and counties, or uploading a GIS spatial file. You can export dashboard visuals as PDF, PowerPoint, or PNG files.


